project flyers
Flyers v1: Manual Mayhem
Table of Contents
- Introduction
- Version 1
- Version 2
- Version 3
- Reporting Dashboard
- Data Cleansing
- Power BI Results
MS Fabric (v4)AI with Power BI
This is part two of a series of short blogs chronicling a pet project I’ve come to know as Flyers. Flyers is a data exploration journey to capture authentic sale prices from local grocery stores and use that data to visualize trends over time. Files associated with this project are available at https://github.com/carsonruebel/Flyers. This article covers the first solution I arrived at, which entailed an unreasonable amount of manual effort.
Identifying and Capturing Attributes
The goals of this project are fairly simple : capture the sale prices from real-world sources and store them in a database to manipulate through Power BI or equivalent tools looking for trends. After reviewing one of the advertisements, let’s manually input the information into a spreadsheet to determine what kind of details we are able to collect.
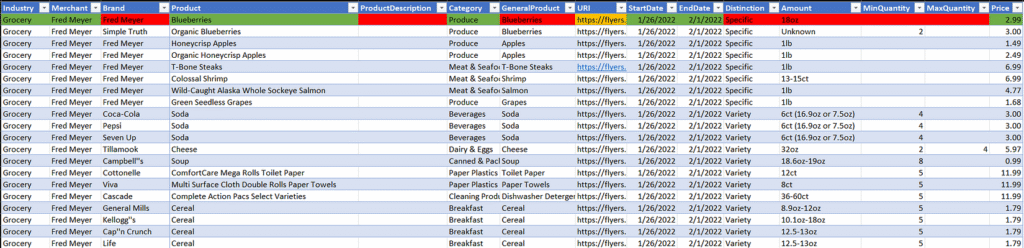
Sample of manual spreadsheet entries
There are two significant challenges to both the collection of data as well as for trend analysis in the future. The first problem is that we will want to perform trend analysis on products in the same way that we shop at a store. For instance, when I want an apple, I don’t go to a specific store and get an apple from a specific provider, or even a specific type of apple. I often just purchase whichever type of apple is currently on sale. This means we need a way to categorize products to be brand-agnostic in order to view trends on a broader level. For this project, I borrowed the existing categorization scheme from Fred Meyer’s website.
The second problem we’ll have is with the advertisements themselves. While there are some advertisements that are very specific (e.g., buy 5 of these for $10.00 ) there are a significant number of advertisements that apply to a range of products within a brand’s offerings, or that pair two products together to avail a sale price. These varieties need to be captured both in the product being sold as well as any differences in the size or quantity of the products in order to be accurate, yet these advertisements are also the most non-specific. To address the problem at this stage, let’s just add a flag attribute to identify whether the advertisement is for a single product or for a variety of products. This will allow us to filter out variety advertisements during the analysis phase as needed.
Given these issues, we can put together a set of attributes to capture in our spreadsheet. There are two types of data we need, data that comes directly from the advertisements (e.g., Price) and categorical or metadata that we manually create (e.g., Industry). The following are the attributes I ended up with.
Attributes Sourced Directly from the Flyer
- Merchant: The store offering the advertisement
- Brand: The brand of the product, which sometimes may not be specified (e.g., fresh produce)
- Product: The specific product being offered, sometimes this is generic as well (e.g., any cereal of a specific size by General Mills)
- Start Date: The start date for the sale
- End Date: The end date for the sale
- Distinction: A flag to determine if the advertisement is for a specific product or for a range of products
- Amount: The unit size of the product (could be by volume, weight, or count)
- Minimum Quantity: The fewest number of products needed to avail the sale price
- Maximum Quantity: The largest number of products allowed with the sale price
- Price: The sale price itself per unit
Attributes Sourced Manually
- Industry: A manual categorization to differentiate between grocery and other types of products such as furnishing and home goods
- Product Description: An optional field to further describe the product
- Category: A second-level manual categorization to differentiate products
- General Product: Due to the inconsistent nature of text used in advertisements, we need consistent terminology to match products, leading to the creation of this manual translation to a standardized product name
- URI: A hyperlink to a photo of the specific advertisement (This was never fully implemented, rather I only saved an image of the flyer as a whole)
Normalizing the Data
The next step in this process is to decide on a table structure for the relational database. For a project of this size, I ended up settling on third normal form. Upon looking back at it, however, I realize that I failed to have it in the first normal form. This oversight occurred as I should have split the ‘Amount’ attribute into two separate attributes to capture unit count and unit size separately. This is evidenced by a cell containing ‘6ct (16.9oz or 7.5oz)’.
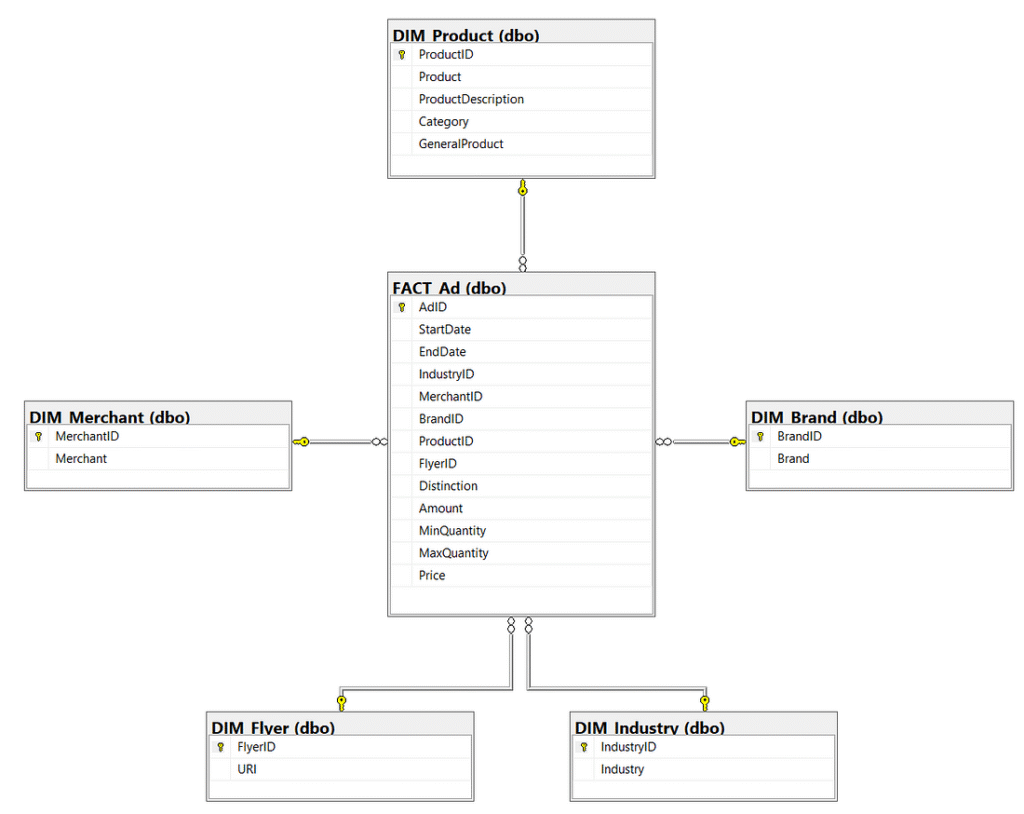
The final result is five dimension tables and a fact table. A simple data dictionary shows the result below.
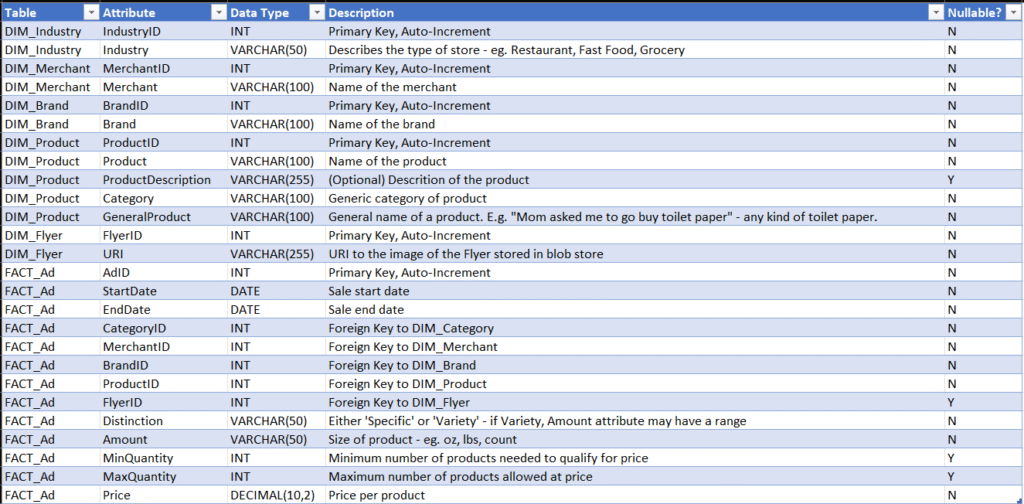
Data Dictionary from v1 solution of Flyers
Putting it in the Cloud
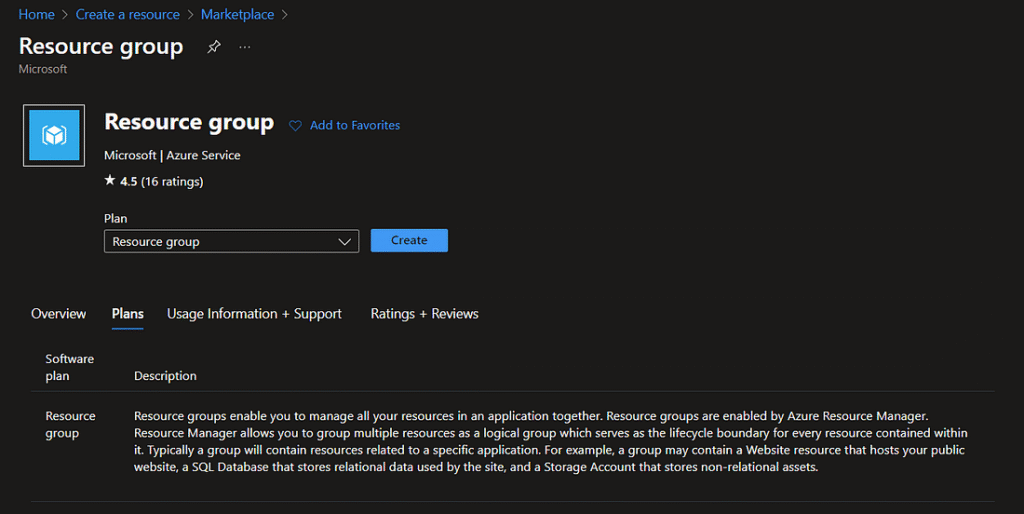
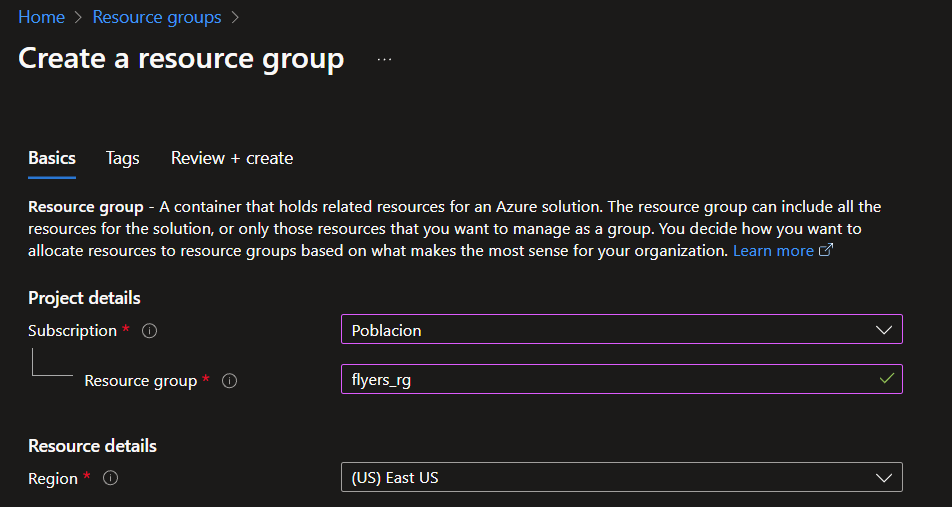
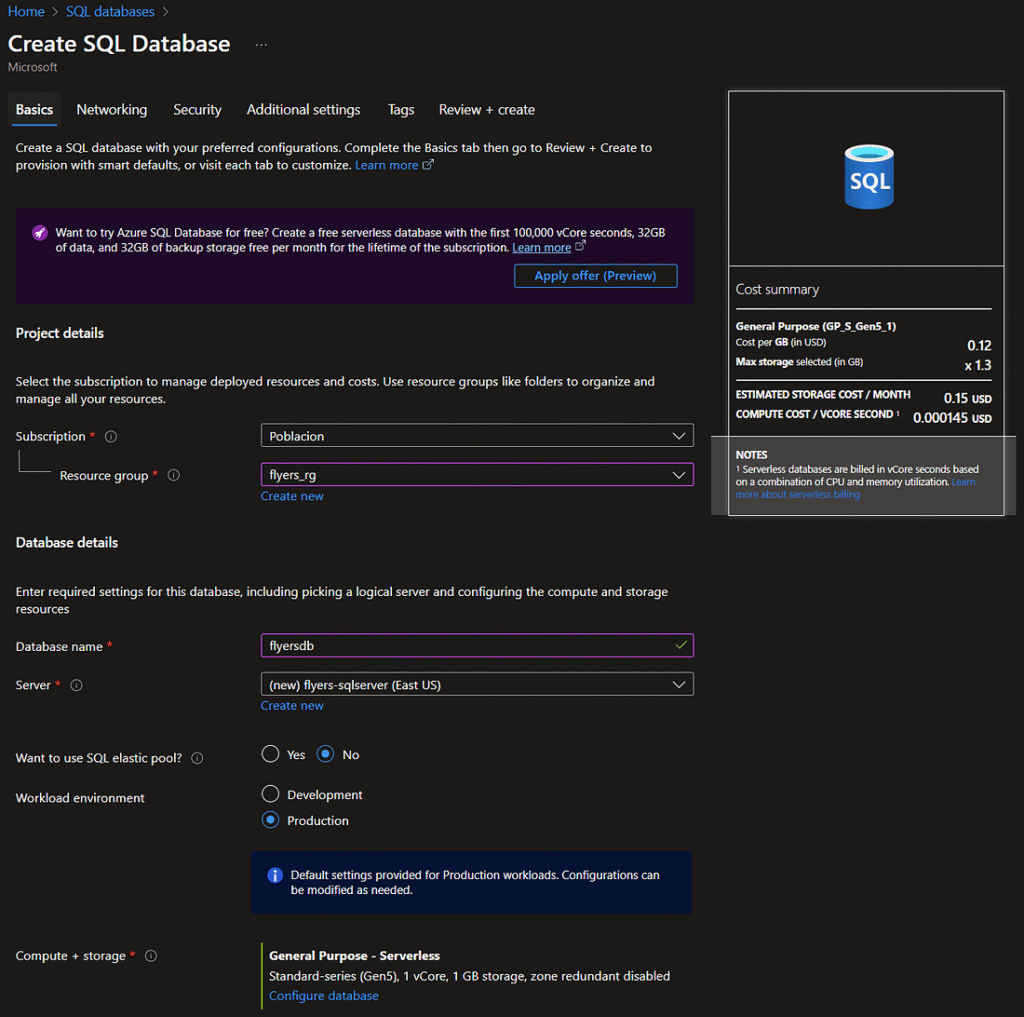
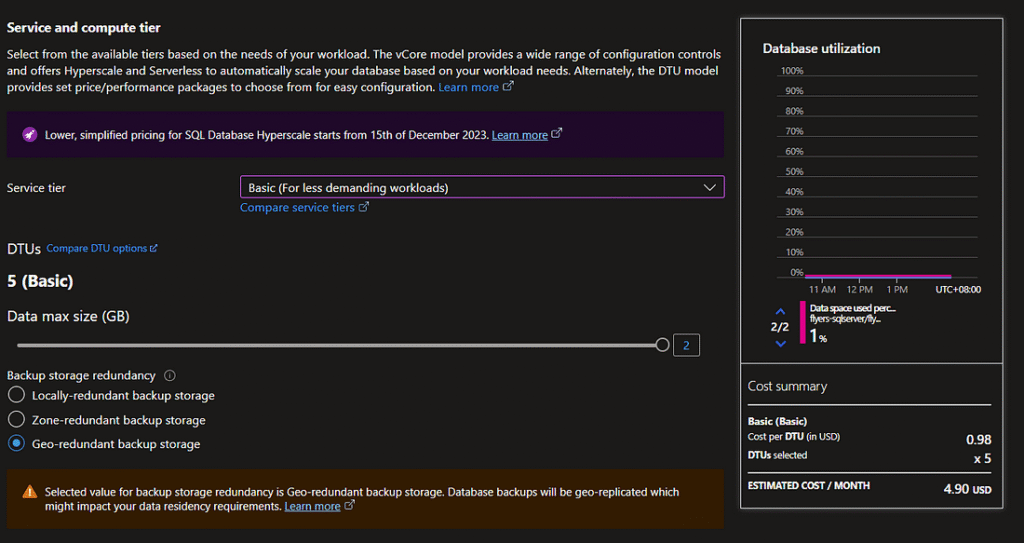
With a chunk of manually entered data ready and a planned database structure, the next course of action is to find a place to store our data. If you don’t already have one, sign up for an Azure subscription. For this project I am using a subscription named ‘Poblacion.’ Once created, our first step is to create a resource group to keep related resources organized as a logical group. Let’s create a resource group called ‘flyers_rg’.
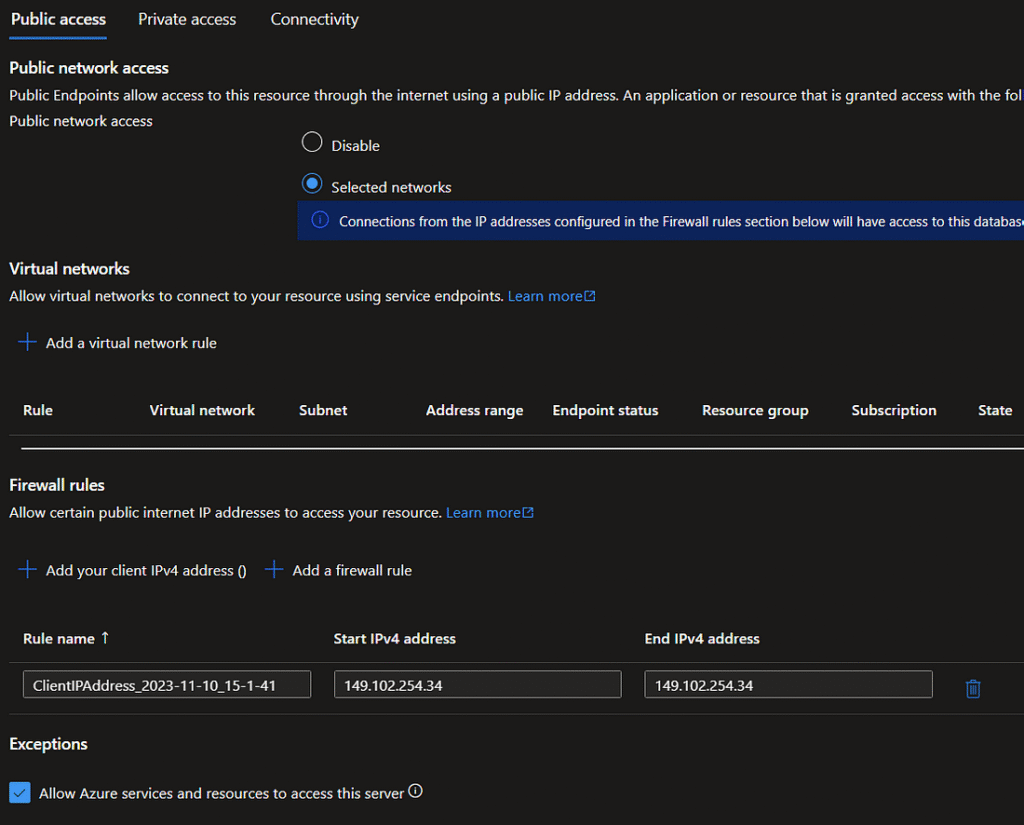
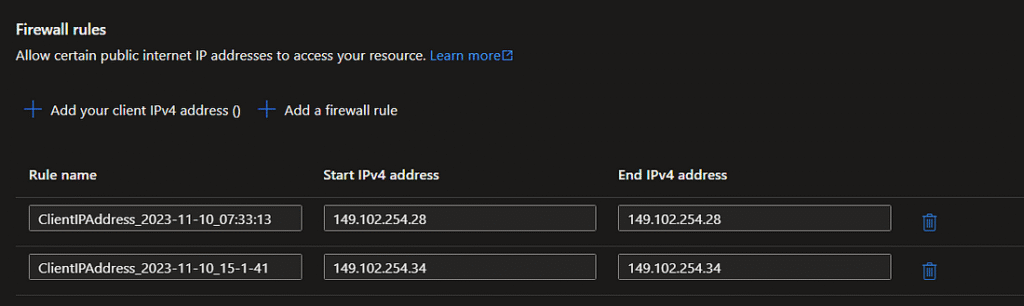
Once the SQL Database is created, we should turn on a firewall as an added measure of protection to only allow access for our client IP address. This setting is applied at the database level, not the server level. For simplicity, set it to ‘selected networks’ and add your client IP as a firewall rule. Azure makes it easy to add IPs to these rules, prompting you when trying to access the database from a different location or via VPN.
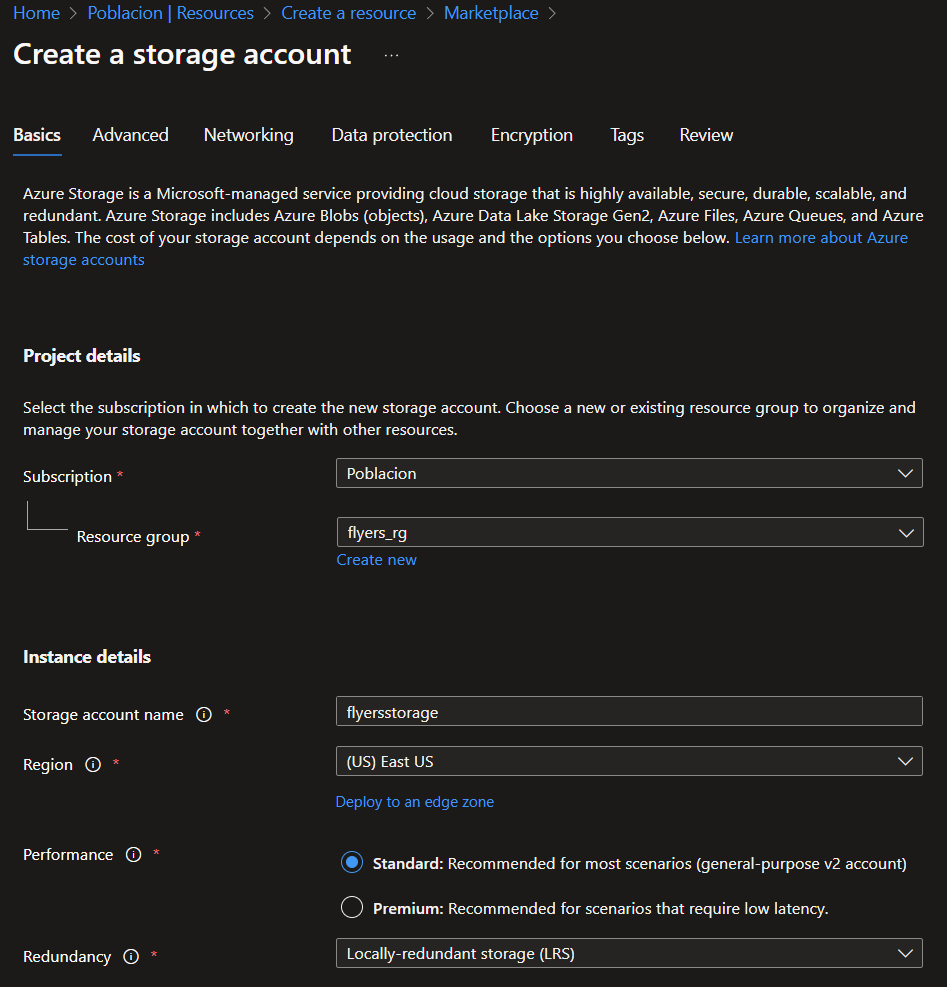
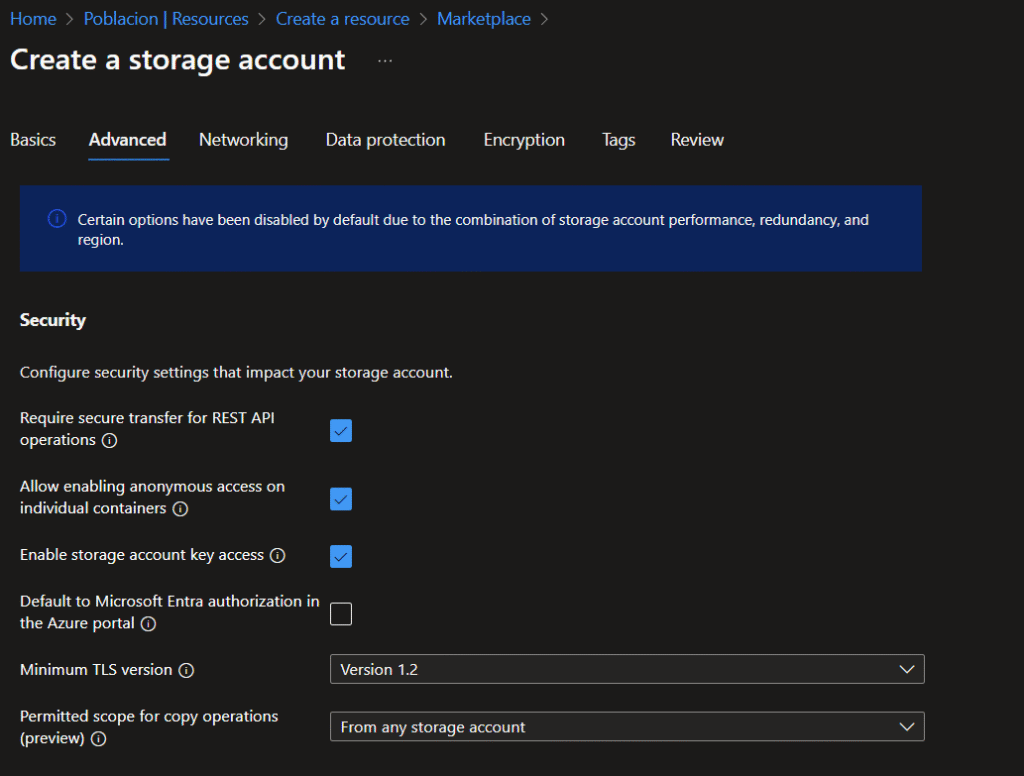
In addition to the SQL Database, we also need a storage account to house the image of the flyer. To do this, create a locally-redundant basic tier storage account named ‘flyersstorage’. On the Advanced tab, enable ‘Allow enabling anonymous access on individual containers’ in order for the file to be accessible.
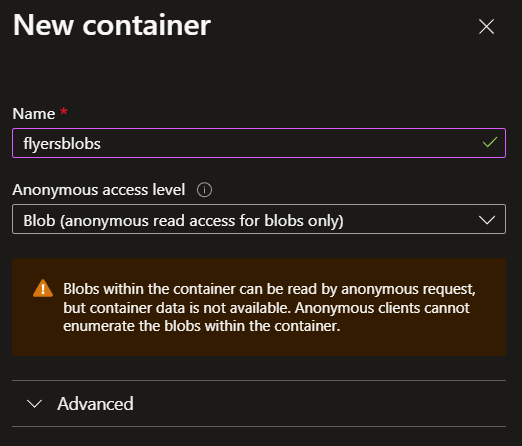
After configuring the storage account, create a container named ‘flyersblobs’ and set its anonymous access level to blob. The final step is to upload the PDF file to our blob storage. Take note of the URL to update the URI column in the database. In this case it is https://flyersstorage.blob.core.windows.net/flyersblobs/FM20220126.pdf.
Uploading DB Records
With all the cloud aspects configured, it’s time to connect to the Azure SQL DB and start writing some T-SQL to upload our data. Azure has a built-in tool called Azure Data Studio to connect to their cloud SQL offering, but I prefer using SQL Server Management Studio (SSMS).
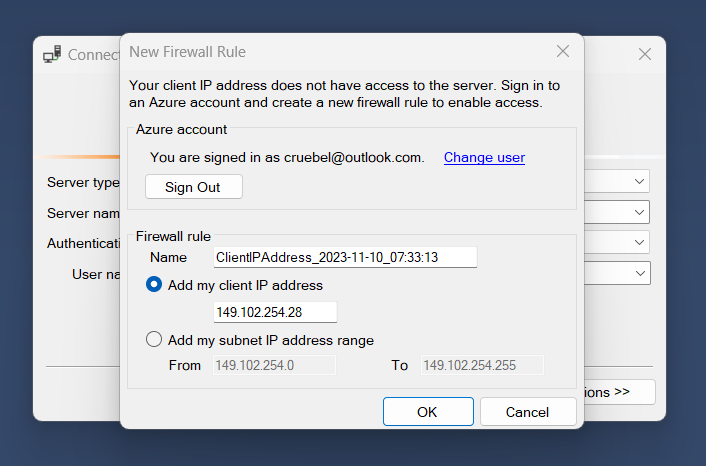
To connect to our new database from SSMS, grab the server name from the overview page of the database in Azure and input it in the SSMS connection screen. For authentication type, if you selected both Microsoft Entrata authentication and SQL authentication when setting up your SQL Database, you have the option to connect via Azure AD or SQL. When I connected, I had already renewed my VPN connection with a new IP Address, so I was prompted to add a new IP Address to the firewall rules.
As you can see, once I clicked through that prompt, a second rule appeared in my SQL firewall settings.
CREATE TABLE DIM_Industry (
    IndustryID INT IDENTITY(1,1) PRIMARY KEY NOT NULL,
    Industry VARCHAR(50) NOT NULL,
);

CREATE TABLE DIM_Merchant (
    MerchantID INT IDENTITY(1,1) PRIMARY KEY NOT NULL,
    Merchant VARCHAR(100) NOT NULL
);

CREATE TABLE DIM_Brand (
    BrandID INT IDENTITY(1,1) PRIMARY KEY NOT NULL,
    Brand VARCHAR(100) NOT NULL
);

CREATE TABLE DIM_Product (
    ProductID INT IDENTITY(1,1) PRIMARY KEY NOT NULL,
    Product VARCHAR(100) NOT NULL,
    ProductDescription VARCHAR(255),
    Category VARCHAR(100) NOT NULL,
    GeneralProduct VARCHAR(100) NOT NULL
);

CREATE TABLE DIM_Flyer (
    FlyerID INT IDENTITY(1,1) PRIMARY KEY NOT NULL,
    URI VARCHAR(255) NOT NULL
);

CREATE TABLE FACT_Ad (
    AdID INT IDENTITY(1,1) PRIMARY KEY NOT NULL,
    StartDate DATE NOT NULL,
    EndDate DATE NOT NULL,
    IndustryID INT FOREIGN KEY REFERENCES DIM_Industry(IndustryID) NOT NULL,
    MerchantID INT FOREIGN KEY REFERENCES DIM_Merchant(MerchantID) NOT NULL,
    BrandID INT FOREIGN KEY REFERENCES DIM_Brand(BrandID) NOT NULL,
    ProductID INT FOREIGN KEY REFERENCES DIM_Product(ProductID) NOT NULL,
    FlyerID INT FOREIGN KEY REFERENCES DIM_Flyer(FlyerID),
    Distinction VARCHAR(50) NOT NULL,
    Amount VARCHAR(50) NOT NULL,
    MinQuantity INT,
    MaxQuantity INT,
    Price DECIMAL(10,2) NOT NULL
);
After running these queries, you’ll be left with five dimension tables connected to a fact table as seen below.
To add our data to these tables, we need to tell the database which table and attribute should receive each piece of information from our spreadsheet. To do this, create a stored procedure that takes data from our spreadsheet one row at a time and distributes the information appropriately.
CREATE PROCEDURE InsertNormalizedAd
    @industry VARCHAR(50),
    @merchant VARCHAR(100),
    @brand VARCHAR(100),
    @product VARCHAR(100),
    @productdescription VARCHAR(255),
    @productcategory VARCHAR(100),
    @generalproduct VARCHAR(100),
    @uri VARCHAR(255),
    @startdate DATE,
    @enddate DATE,
    @distinction VARCHAR(50),
    @amount VARCHAR(50),
    @min INT,
    @max INT,
    @price DECIMAL(10,2)
AS
BEGIN
--check if industry exists
    DECLARE @industryid INT;
    SET @industryid = (
        SELECT IndustryID FROM DIM_Industry
        WHERE Industry = @industry
    );
    IF @industryid IS NULL
    BEGIN
    --insert into dim_industry
        INSERT INTO DIM_Industry
            VALUES (@industry);
    --set @industryid to newly created industryID
        SET @industryid = (
            SELECT IndustryID FROM DIM_Industry
            WHERE Industry = @industry
        );
    END
--check if merchant exists
    DECLARE @merchantid INT;
    SET @merchantid = (
        SELECT MerchantID FROM DIM_Merchant
        WHERE Merchant = @merchant
    );
    IF @merchantid IS NULL
    BEGIN
    --insert into dim_merchant
        INSERT INTO DIM_Merchant
            VALUES (@merchant);
    --set @merchantid to newly created merchantID
        SET @merchantid = (
            SELECT MerchantID FROM DIM_Merchant
            WHERE Merchant = @merchant
        );
    END
--check if brand exists
    DECLARE @brandid INT;
    SET @brandid = (
        SELECT BrandID FROM DIM_Brand
        WHERE Brand = @brand
    );
    IF @brandid IS NULL
    BEGIN
    --insert into dim_brand
        INSERT INTO DIM_Brand
            VALUES (@brand);
    --set @brandid to newly created brandID
        SET @brandid = (
            SELECT BrandID FROM DIM_Brand
            WHERE Brand = @brand
        );
    END
--check if product exists
    DECLARE @productid INT;
    SET @productid = (
        SELECT ProductID FROM DIM_Product
        WHERE Product = @product
    );
    IF @productid IS NULL
    BEGIN
    --insert into dim_product
        INSERT INTO DIM_Product
            VALUES (@product, @productdescription, @productcategory, @generalproduct);
    --set @productid to newly created productID
        SET @productid = (
            SELECT ProductID FROM DIM_Product
            WHERE Product = @product
        );
    END
--check if flyer exists
    DECLARE @flyerid INT;
    SET @flyerid = (
        SELECT FlyerID FROM DIM_Flyer
        WHERE URI = @uri
    );
    IF @flyerid IS NULL
    BEGIN
    --insert into dim_flyer
        INSERT INTO DIM_Flyer
            VALUES (@uri);
    --set @flyerid to newly created flyerID
        SET @flyerid = (
            SELECT FlyerID FROM DIM_Flyer
            WHERE URI = @uri
        );
    END
--insert fact entry
    INSERT INTO FACT_Ad
        VALUES (@startdate, @enddate, @industryid, @merchantid, @brandid, @productid, @flyerid, @distinction, @amount, @min, @max, @price);
END;
GO
Now that we have the tables built and a procedure to put our data into the tables, we can begin uploading our data. Given the very manual nature of this solution, each row of data has its own INSERT command, as seen in the spreadsheet containing manually entered data. In column Q, I used a formula to take the details from the spreadsheet and concatenate them into the format needed by our stored proc. From there a special ‘paste as value’ into column R allows direct copying and pasting into SSMS, where they can be executed in bulk (sample of one execute statement below).
exec InsertNormalizedAd 'Grocery', 'Fred Meyer', 'Fred Meyer', 'Blueberries', NULL, 'Produce', 'Blueberries', 'https://flyersstorage.blob.core.windows.net/flyersblobs/FM20220126.pdf', '2022-01-26', '2022-02-01', 'Specific', '18oz', NULL, NULL, '2.99';
The data is now in a relatively normalized format that is friendly for use by analysts and for presentation in reports. If you want to see the data in a readable format similar to the input spreadsheet, you’ll need to join the tables together. I’ve included a query to do this in the query list.
SELECT i.Industry, m.Merchant, b.Brand, p.Product, p.ProductDescription, p.Category, p.GeneralProduct, f.URI, fact.StartDate, fact.EndDate, fact.Distinction, fact.Amount, fact.MinQuantity, fact.MaxQuantity, fact.Price
FROM [dbo].[FACT_Ad] fact
LEFT JOIN DIM_Industry i on fact.IndustryID = i.IndustryID
LEFT JOIN DIM_Merchant m on fact.MerchantID = m.MerchantID
LEFT JOIN DIM_Brand b on fact.BrandID = b.BrandID
LEFT JOIN DIM_Product p on fact.ProductID = p.ProductID
LEFT JOIN DIM_Flyer f on fact.FlyerID = f.FlyerID
Visualizing the Data
I’ll be presenting the visual aspects of this project a little differently. All three versions of this project are combined in a single Power BI file, each contained within its own tab. At the time of building this project I had little to no data to work with, so I kept a very consistent theme across the three versions.
My original goal was to track sale prices of various products over time. Due to this, my report centers around a simple line chart with price on the y-axis and time on the x-axis. Arranged to the left and right of the line chart are various slicers I expect to be valuable. These can and probably will change once I have explored the data, but they will give a nice starting point to dive into the data and look around. As a reminder, the challenges identified early on for analysis were:
- Some sales require a minimum quantity
- Some sales limit to a maximum quantity
- Some sales apply to a variety of products, each with different volumes or quantities
- Some products, such as produce, do not have a defined brand
- Generally, the more complex an advertisement is, the fewer details are available, and the more difficult it is to correctly capture and store details
Once I have filtered the report down to a particular family or category of products, I expect I’ll want to see additional details on specific values. In order to easily get a snapshot of this information, I added a standard table visual that gives a subset view of details similar to the original input spreadsheet.
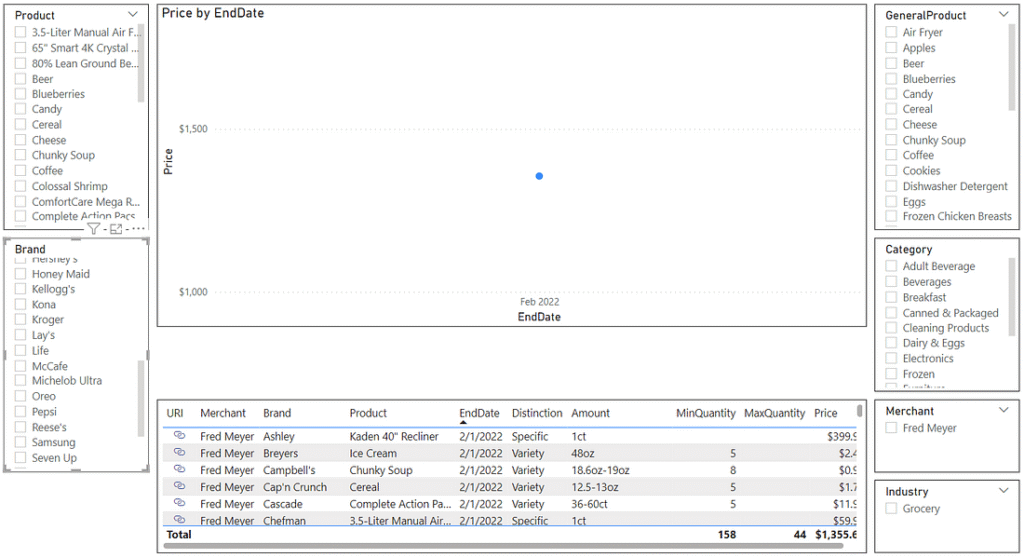
Flyers v1 PowerBI Dashboard unfiltered
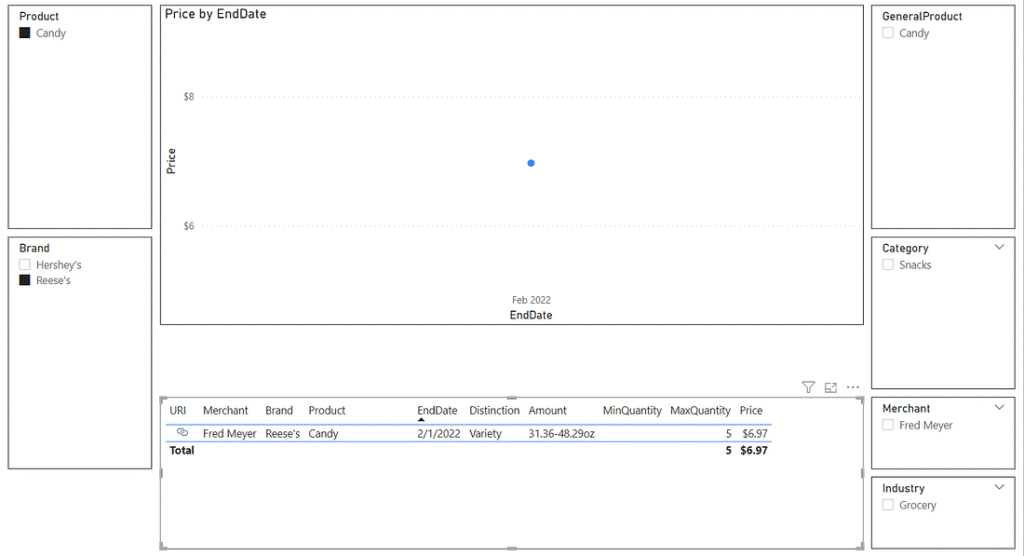
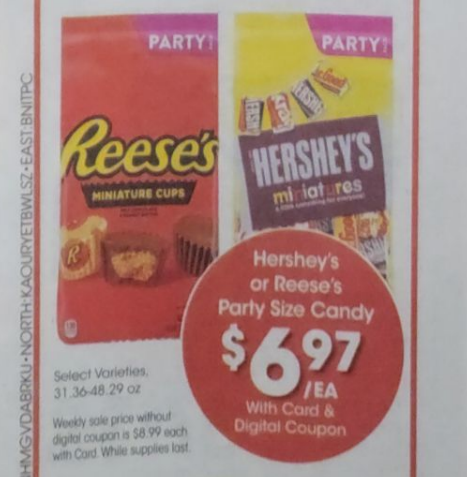
Performing a quick filter to a random product immediately surfaces some of the challenges we will face in the analysis portion of this project. Filtering down to Reese’s candy shows an amount, or size of the product as being 31.36–48.29 oz. Upon looking at the photograph of the actual advertisement, you can see how we ended up with this value: the advertisement combined two separate products into one advertisement. The same price applies to a party-size package of Reese’s candy as a party-size package of Hershey’s candy, each presumably being a different size, hence us not being able to determine which size applies to which product. This will impact us in the future as we will not be able to programmatically compare the sale price of Reese’s miniature cups to future prices unless we somehow stumble upon the same pairing of products advertised in a similar fashion.
As a final thought for this version, you can see that in the unfiltered screenshot there is still only one data point displayed, and it is the total of every sale price advertised for the particular flyer. This may prove useful in the future, but more likely I will want each individual product to display as its own line. This will need to be tackled in later versions that have gathered data over time, as I’ll need to differentiate by product yet ignore advertisement dates that would otherwise cause the report to view them as unique products (e.g., Reese’s candy from Feb 1, 2022, and Reese’s candy from April 15, 2023, might show up as individual data points instead of the continuation of a single line).