project flyers
Flyers v2: Python Helps Out
Table of Contents
- Introduction
- Version 1
- Version 2
- Version 3
- Reporting Dashboard
- Data Cleansing
- Power BI Results
MS Fabric (v4)AI with Power BI
This is part three of a series of short blogs chronicling a pet project I’ve come to know as Flyers. Flyers is a data exploration journey to capture authentic sale prices from local grocery stores and use that data to visualize trends over time. Files associated with this project are available at https://github.com/carsonruebel/Flyers. This article covers the second solution I arrived at, which utilizes Python and Windows batch files to automate the tedious process of manually entering advertisement data.
Obtaining the Data
My first thought when approaching a solution to automate the most painfully manual parts of the first version was to choose a handful of local stores, identify their online advertisement, and scrape the details from a website. A few searches later led me to a site that did all this for me and more: ███. Just as a quick aside, I ended up using their website and app afterwards for my own shopping, and it’s quite handy. If you get nothing else from these articles, you might at least end up with a new tool to save some money in the never-ending need for groceries!
I don’t remember how I originally found the API endpoint to bypass their UI. It may have been from playing with their site or finding a related project someone else had previously done, but there is an API that we can use for our needs: █████████. We can select five stores that are supported by ███ and build a Python script to pull data from them. The code to do this is fairly self-explanatory with the comments and abandoned lines. In a nutshell, there are two functions, one of which pulls and cleans data for a given store, and the other appends this new data into a locally-stored Excel file in the same folder as the script. These functions both use pandas to manipulate the data as needed. The results returned by the API give several additional pieces of information compared to our first version, some of which are valuable and some of which are not needed. We will strip out the unnecessary parts before merging and keep the valuable pieces, prompting some changes to the SQL table structure from v1. The five stores (using a local zip code) are Fred Meyer, Walmart, QFC, Safeway, and Albertsons. Below is the entire Python script.
#imports
import requests
import json
import csv
import pandas as pd
from pandas import json_normalize
from os.path import exists

def pull_data(storename):
    #pull fresh API data
    request_url = '█████████' + storename
    response_API = requests.get(request_url)
    data = response_API.text
    parse_json = json.loads(data)
    json_items = parse_json['items']
    df_new = json_normalize(json_items)
    df_new = df_new.drop(['score','item_weight','bottom','left','right','top'], axis = 1)
    df_new = df_new.dropna(subset=['current_price'])
    df_new.insert(0, 'Industry', 'Supermarket')
    df_new['name'] = df_new['name'].str.replace("'","''")
    #df_new.rename(columns={"name": "Product", "merchant_name": "Merchant"}) #placeholder in case I want to rename columns
    #print(df_new)
    #Only uncomment below to start a new file
    if exists('adhistory.xlsx') == 0:
        #df_new.to_excel('adhistory.xlsx', index=False)
        with pd.ExcelWriter('adhistory.xlsx') as writer:
            df_new.to_excel(writer, sheet_name='RawInput', index=False)
    #if exists('adhistory2.json') == 0:
    #    df_new.to_json('adhistory2.json')
    return df_new

def merge_data(filename, dataframe):
    #load offline data to dataframe
    df_old = pd.read_excel(filename + ".xlsx")
    #print(df_old)

    #append together (with concat?)
    df_combined = pd.concat([df_old, dataframe], axis=0)
    #df_combined.to_csv('datafile2combined.csv', index=False)
    #print(df_combined)

    #remove duplicates
    df_final = df_combined.drop_duplicates()
    #print(df_final)

    #how many rows were added?
    added_row_count = df_final.shape[0] - df_old.shape[0]

    #store back as original file
    #df_final.to_excel(filename + ".xlsx", index=False)
    with pd.ExcelWriter('adhistory.xlsx', mode='a', if_sheet_exists='replace') as writer:
        df_final.to_excel(writer, sheet_name='RawInput', index=False)
    #df_final.to_json(filename + ".json")
    return added_row_count

#start main code
df = pull_data('FredMeyer')
print("FredMeyer added " + str(merge_data('adhistory', df)) + " rows")
df = pull_data('Walmart')
print("Walmart added " + str(merge_data('adhistory', df)) + " rows")
df = pull_data('QFC')
print("QFC added " + str(merge_data('adhistory', df)) + " rows")
df = pull_data('Safeway')
print("Safeway added " + str(merge_data('adhistory', df)) + " rows")
df = pull_data('Albertsons')
print("Albertsons added " + str(merge_data('adhistory', df)) + " rows")
With this script, all we need to do is write a quick batch file and use the built-in Task Scheduler to execute the batch file on a recurring basis. Since we will need our computer to be on, awake, and connected to the web for the task scheduler to work correctly, let’s set it to run every hour. Watching the results of this overly zealous schedule, you may notice that each time it runs you might still be adding a few lines of results to your spreadsheet even without the underlying advertisements changing. From this, it’s a reasonable assumption that the API limits the number of results returned per pull. Running the script this often partially rectifies the issue as we get a few additional rows per run, though it’s not a real solution. I decided not to pursue this issue as I was already comfortable with using their API, and there weren’t a lot of options for me to go around that limit without drastic changes. The batch file is a simple command to run our python script.
"C:\Python39\python.exe" "C:\Users\Carson\Desktop\Current Projects\Flyers\GitRepo\Flyers\v2 ETL\DailyLoadFlyers.py"
New Data Model
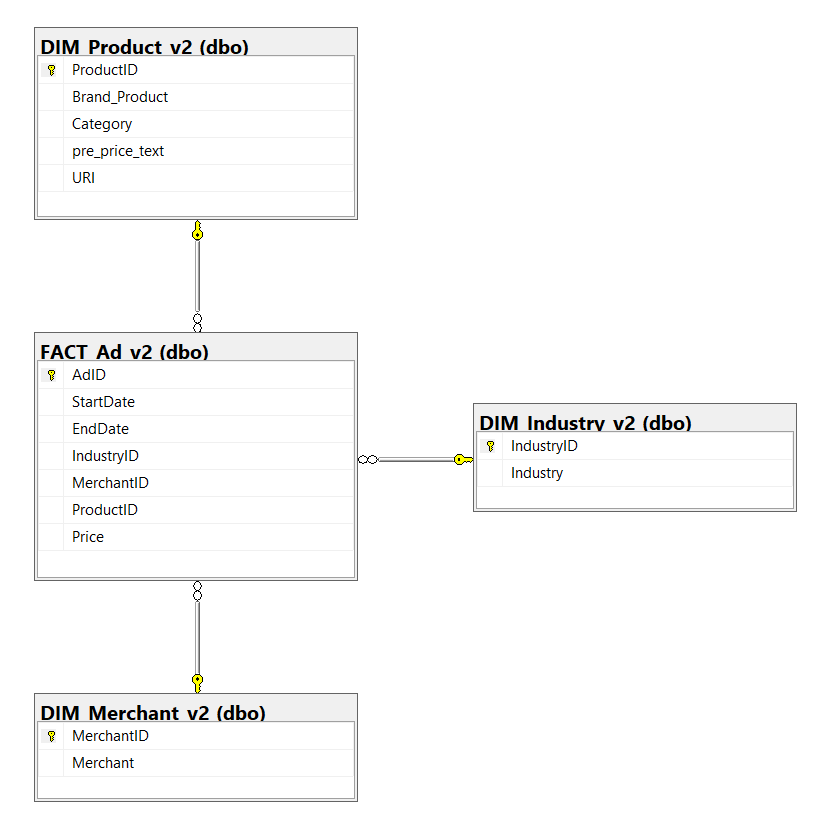
Given that we switched from a manual method of capturing data to pulling from an API, there are some differences in the data we are able to obtain. Within the Python script, we remove several columns and add an ‘Industry’ attribute that is hardcoded to ‘Supermarket’ (really just for consistency with the v1 solution as hardcoding a single value really doesn’t add anything to our ability to derive insights later). One notable change is the lack of brand being a separate attribute. It comes out of the API bundled with the product name, hence the new ‘Brand_Product’ attribute and the lack of a distinct DIM_Brand table. We also no longer need a flyer URI to an image stored on our Blob storage as we now have a URL to an image for each individual advertisement that we can store in the DIM_Product table. Finally, there is a ‘pre_price_text’ attribute that comes from the API that is often used to convey additional information, such as if the price listed is for two of the items instead of one. To account for these differences, let’s create our new tables as follows.
CREATE TABLE DIM_Industry_v2 (
    IndustryID INT IDENTITY(1,1) PRIMARY KEY NOT NULL,
    Industry VARCHAR(50) NOT NULL,
);

CREATE TABLE DIM_Merchant_v2 (
    MerchantID INT IDENTITY(1,1) PRIMARY KEY NOT NULL,
    Merchant VARCHAR(100) NOT NULL
);

CREATE TABLE DIM_Product_v2 (
    ProductID INT IDENTITY(1,1) PRIMARY KEY NOT NULL,
    Brand_Product VARCHAR(100) NOT NULL,
    Category VARCHAR(100) NULL,
    pre_price_text VARCHAR(100) NULL,
    URI VARCHAR(255) NOT NULL
);

CREATE TABLE FACT_Ad_v2 (
    AdID INT IDENTITY(1,1) PRIMARY KEY NOT NULL,
    StartDate DATE NOT NULL,
    EndDate DATE NOT NULL,
    IndustryID INT FOREIGN KEY REFERENCES DIM_Industry_v2(IndustryID) NOT NULL,
    MerchantID INT FOREIGN KEY REFERENCES DIM_Merchant_v2(MerchantID) NOT NULL,
    ProductID INT FOREIGN KEY REFERENCES DIM_Product_v2(ProductID) NOT NULL,
    Price DECIMAL(10,2) NOT NULL
); 
Uploading DB Records
For this version of the project, we won’t automate the process of moving the data from a local spreadsheet to SQL. This is due to a couple of reasons. The first reason is that the amount of manual effort and chance for human error is now very low. We can upload as frequently or infrequently as we want, and there is no manual typing or transcription. The second reason is that it was around this point that I started thinking about a version 3 for the project that would make use of cloud and serverless technology.
In order to upload data to the SQL database for the v2 solution, we will utilize the same concept as was done in the first version. Each row of data will have its own Excel concat string that contains an execute statement to call a stored procedure in SQL. In order to track which rows we have already entered, simply highlight the columns in the history spreadsheet after they have been entered into the DB. The updated stored procedure for v2 is below, along with another sample of one execute statement.
CREATE PROCEDURE InsertNormalizedAd_v2
    @industry VARCHAR(50),
    @merchant VARCHAR(100),
    @brandproduct VARCHAR(100),
    @productcategory VARCHAR(100),
    @prepricetext VARCHAR(100),
    @uri VARCHAR(255),
    @startdate DATE,
    @enddate DATE,
    @price DECIMAL(10,2)
AS
BEGIN
--check if industry exists
    DECLARE @industryid INT;
    SET @industryid = (
        SELECT IndustryID FROM DIM_Industry_v2
        WHERE Industry = @industry
    );
    IF @industryid IS NULL
    BEGIN
    --insert into dim_industry_v2
        INSERT INTO DIM_Industry_v2
            VALUES (@industry);
    --set @industryid to newly created industryID
        SET @industryid = (
            SELECT IndustryID FROM DIM_Industry_v2
            WHERE Industry = @industry
        );
    END
--check if merchant exists
    DECLARE @merchantid INT;
    SET @merchantid = (
        SELECT MerchantID FROM DIM_Merchant_v2
        WHERE Merchant = @merchant
    );
    IF @merchantid IS NULL
    BEGIN
    --insert into dim_merchant_v2
        INSERT INTO DIM_Merchant_v2
            VALUES (@merchant);
    --set @merchantid to newly created merchantID
        SET @merchantid = (
            SELECT MerchantID FROM DIM_Merchant_v2
            WHERE Merchant = @merchant
        );
    END
--check if product exists
    DECLARE @productid INT;
    SET @productid = (
        SELECT ProductID FROM DIM_Product_v2
        WHERE Brand_Product = @brandproduct
    );
    IF @productid IS NULL
    BEGIN
    --insert into dim_product_v2
        INSERT INTO DIM_Product_v2
            VALUES (@brandproduct, @productcategory, @prepricetext, @uri);
    --set @productid to newly created productID
        SET @productid = (
            SELECT ProductID FROM DIM_Product_v2
            WHERE Brand_Product = @brandproduct
        );
    END
--insert fact entry
    INSERT INTO FACT_Ad_v2
        VALUES (@startdate, @enddate, @industryid, @merchantid, @productid, @price);
END;
GO
exec InsertNormalizedAd_v2 'Supermarket', 'Fred Meyer', 'Fred Meyer Purified Drinking Water', 'Beverages', '', '█████████████', '2022-02-16', '2022-02-23', '2.49';
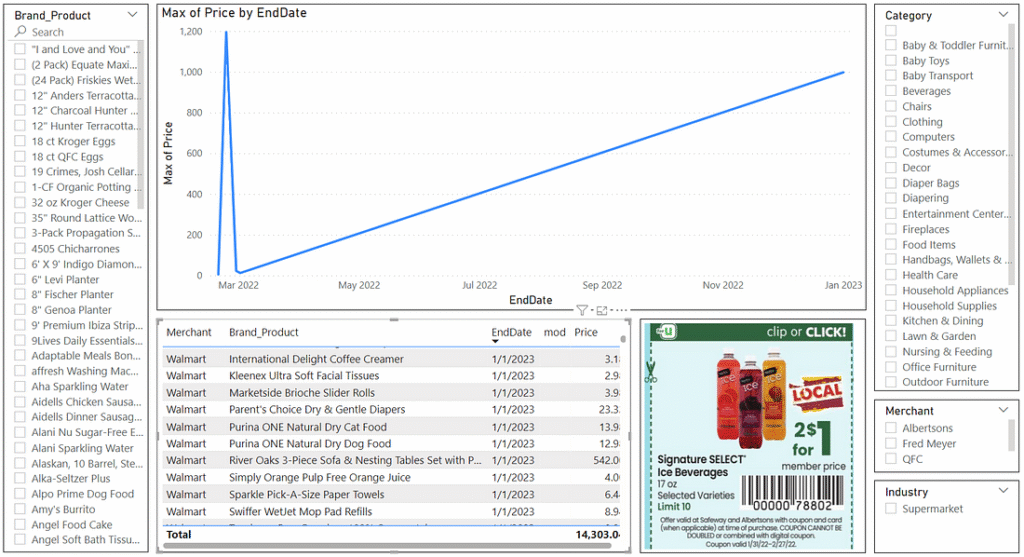
Visualizing the Data
There are some notable differences between the information manually entered in v1 and the information pulled from the API in v2. We lost the distinction between product and brand, we lost the manually created ‘General Product’ attribute, and we gained an image URL for each individual ad. For the reporting aspect, I did not have nearly enough data to perform any analysis and modify the visualizations based on findings, so I kept the same structure as much as possible while accounting for these differences. On the left side, ‘Product’ and ‘Brand’ simply merged into a single ‘Brand_Product’ slicer. On the right side, ‘Category’ expanded to cover the space from the lost ‘General Product’ attribute. In the center, I added a visualization of the given selected ad.