project flyers
Flyers : A Data Exploration Journey
Table of Contents
- Introduction
- Version 1
- Version 2
- Version 3
- Reporting Dashboard
- Data Cleansing
- Power BI Results
MS Fabric (v4)AI with Power BI
Preface
This set of articles is being published as-is in June 2025. The underlying work took place in 2022, and the articles themselves were written in 2023. I never published them at the time because, although I assumed the API I used was public, I later realized I may have been using it against its written terms of use. I am publishing these now with minimal modifications, simply redacting the actual API references and making the code repository private.
I don’t believe in throwing away work, and the underlying problems, decisions, and solutions remain relevant even if a few years outdated. I’m also including the partially written final article for completeness, given the unusual release circumstances.
This series is for educational and illustrative purposes only. Please review and comply with the terms of service of any APIs or services you use in your own projects.
Introduction
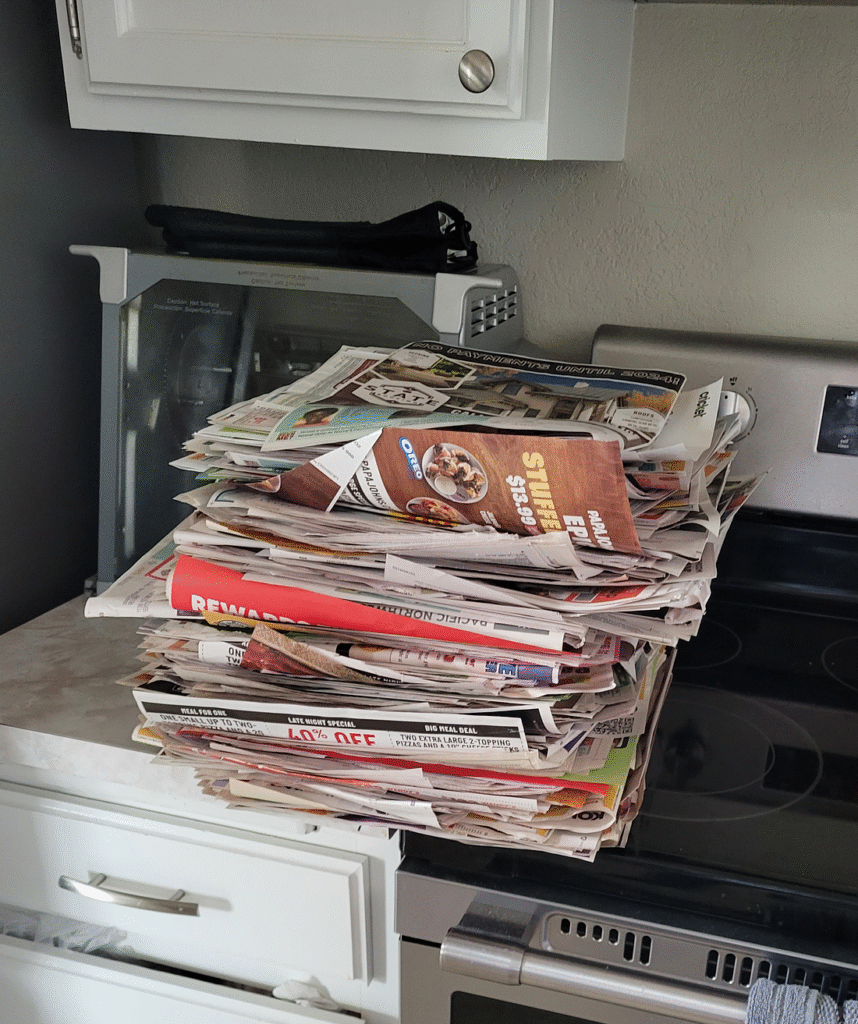
- Version 1: Manual input from paper flyers
- Version 2: Local Python script executing daily to pull from a public API
- Version 3: Azure Data Factory to load data from the API to SQL using serverless offerings
Technology Used
- All Versions: Make use of an Azure SQL Database as a sink
- All Versions: Makes use of T-SQL (using SSMS) stored procedures to parse out data into normalized dim/fact tables
- Version 1: Uses Excel formulas to build batch SQL queries to input data into the DB
- Version 2: Uses Python to pull and append flyer details from a public API to a CSV file
- Version 3: Uses Azure Data Factory to extract, transform, and load data from a public API into normalized dim/fact tables
- All Versions: Make use of Power BI to view the data with slicers to select individual products, families of products, and stores to view price trends over time
Risks and Assumptions
Data Quality
- Advertisements have no standardization! Some will list a minimum required quantity to get a sale price. Some will appear to have a minimum but may not actually be required. Some will combine a mix and match of brands and products. Many are broad categories that cover multiple products. To address these challenges, our mitigation strategy is to add a new column specifying if the advertisement is for a single product or a variety. This enables us to isolate individual products for building price trends.
Version 1
- Data entry takes an incredibly long time and is not practical. It takes upwards of 5 hours to input a single store’s weekly flyer.
- Risk of human error is very high.
Version 2
- Python script is set to run hourly using Windows Task Scheduler, meaning there is a dependency on my machine being online and logged in frequently enough to capture data.
- Manual work needs to be done periodically to build stored proc calls and execute them to upload data to SQL.
- Images of advertisements are not stored in the solution, meaning there is a dependency on the API service maintaining advertisement images on their own servers (this risk applies to v3 as well).
Version 3
- There is an assumption that the public API remains available while running without manual intervention.