project flyers
Flyers: Data Cleansing
Table of Contents
- Introduction
- Version 1
- Version 2
- Version 3
- Reporting Dashboard
- Data Cleansing
- Power BI Results
MS Fabric (v4)AI with Power BI
This is part six of a series of short blogs chronicling a pet project I’ve come to know as Flyers. Flyers is a data exploration journey to capture authentic sale prices from local grocery stores and use that data to visualize trends over time. Files associated with this project are available at https://github.com/carsonruebel/Flyers. This article covers the identification of an ETL issue, the implementation of fixing it, and general cleaning of the existing data to derive insights from reports.
Reviewing for Data Errors
The time came to start looking over the results after the project had been running for 22 months. I had my fingers crossed that there were no major issues that would render the captured data worthless, but naturally there were several issues to address. I suppose this is to be expected when you change gears and don’t follow up on a solution to ensure it’s acting as desired. There were four primary issues I identified.
- Azure Data Factory would constantly run into timeout issues as alluded to in a previous post. All of the API pulls are combined into a single ADF pipeline, meaning when one of the API pulls doesn’t complete, none of the data for the day is loaded.
- The report had many instances where the price didn’t make sense as a trend (e.g. it would drop to half and then back up to original). Looking further into this issue showed that the image for these price oddities did not agree with the stated price. This was the largest issue I had to address.
- While investigating the above issue with price abnormalities and prices not agreeing with images, I found that there were instances where a brandproduct attribute had a name longer than what I allowed in the table schema. This wasn’t a critical issue as it didn’t prevent data from flowing in, but it did cut off product names to where they may be less understandable.
- Also while investigating the price abnormalities, the API began erroring for Fred Meyer as no results were being returned for the search query. This appeared to be very lucky timing to occur while I was working on other issues, otherwise it could have taken time for me to notice the broken pipeline.
Addressing Data Errors
ADF Timeout issue
Load failures are definitely an issue, but depending on how frequently they occurred the underlying data might not be affected too badly. Since advertisements do not change on a daily basis, the impact really kicks in after seven days. I arrived at this by assuming most advertisements change on a weekly schedule, and if the first failure in a series begins the same day an advertisement changes, we will need seven days in a row of failures to lose the data. To see the longest periods of time with consistent failures we can run the following query.
BEGIN
    CREATE TABLE #temptable (
        LoadDate date,
        NumDays INT
    )

    DECLARE @adidold AS INT = 0
    DECLARE @adidnew AS INT
    DECLARE @loaddate AS DATE

    DECLARE c CURSOR FOR
        SELECT LoadDate, MIN(AdID) idd
        FROM FACT_Ad_v3
        GROUP BY LoadDate
        ORDER BY LoadDate

    OPEN c
    FETCH NEXT FROM c INTO @loaddate, @adidnew

    WHILE @@FETCH_STATUS = 0
    BEGIN
        INSERT INTO #temptable VALUES (
            @loaddate,
            (
                SELECT CAST(CAST(@loaddate AS DATETIME) AS INT)
                     - CAST(CAST((SELECT Loaddate FROM FACT_Ad_v3 WHERE AdID = @adidold) AS DATETIME) AS INT)
            )
        )
        SET @adidold = @adidnew
        FETCH NEXT FROM c INTO @loaddate, @adidnew
    END

    CLOSE c
    DEALLOCATE c

    SELECT * FROM #temptable
    ORDER BY NumDays DESC

    DROP TABLE #temptable
END
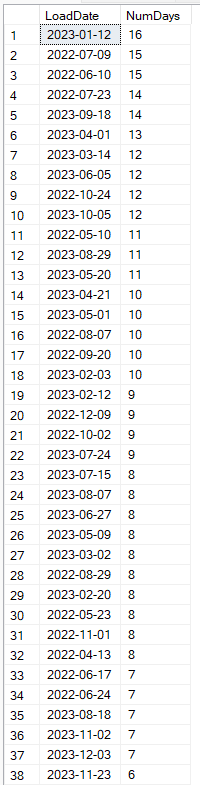
The results of this query show a lot more missing data than I was hoping for. The key cut-off periods we care about are 7, 13, and 14. To calculate the maximum data sets that are missing we will look at the worst case scenario where the first failure in a series begins the same day an advertisement changes, meaning we will need seven days in a row of failures to lose the data. Likewise, missing two periods of data could occur in as little time as 14 days. To calculate the minimum data sets that are missing we will look at the best case scenario where the failures start the day after an advertisement changes and resumes on the last day of the following data set (think a Tuesday through the following Sunday) resulting in a gap of 13 days potentially not losing data. There are 37 instances where data failed to load for at least 8 days, and 5 periods of at least 14 days, Giving us a maximum of 42 lost data periods. There are 6 periods of missing loads for at least 13 days. Therefore there are between 6 and 42 missing sets of advertisement data prior to implementing a solution to address API timeouts, which occurred about 21.5 months after the pipeline began running, which is roughly 93 weeks. This tells us we should still have between 51 and 87 sets of weekly advertisement data for analysis.
There are a handful of approaches that can be taken when investigating pipeline issues.
- Invest additional time to deep dive into the root cause of the failures. There might be a timeout setting that would fix the issue (in fact there is a timeout setting within the dataflow transformation, however all my tests show the API returning results in a matter of seconds, much faster than the default 30 seconds timeout).
- Add pipeline logic to kick off additional workflow upon failure. The simplest of these would be to send a notification upon failure to an email address that the responsible owner/team would monitor. This would alert someone that the pipeline failed, and allow the appropriate party to check for underlying changes that may have caused the failure, or kick off the pipeline again as needed.
- The pipeline and dataflows could be separated by store so that a failure loading one doesn’t prevent the others from loading. There is a balance of cost and value to consider when making changes that will cause the cost of operations to increase. Each dataflow requires an Apache Spark Cluster to spin up, which takes up the majority of the computation time. Splitting one dataflow into five separate dataflows would roughly 5x the cost of running this project.
- The pipeline can be set to retry a certain number of times. This is the simplest solution. It will potentially cause ADF to use more resources as it will continue attempting to run for the specified number of attempts. The difference between this solution and splitting the dataflows (or even more extreme a combination of splitting and setting a maximum number of retries) is that splitting the dataflows guarantees longer execution times as each dataflow will require a cluster to spin up. Setting a maximum number of retries for the pipeline could execute on the first time and be finished early.
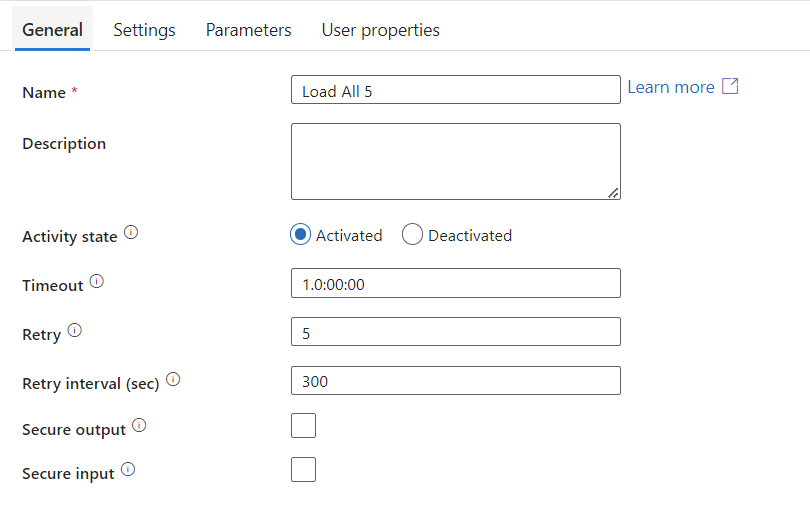
Given this is not a production environment and it is a pet project, I opted to set the pipeline to retry up to five times before giving up. Losing even several days in a row is not critical for this project as advertisements do not change every day. They tend to change weekly, or even monthly. See below where I set the maximum number of retries to five and the wait period between attempts to five minutes (in case the timeout is due to excess traffic server-side).
Price abnormalities
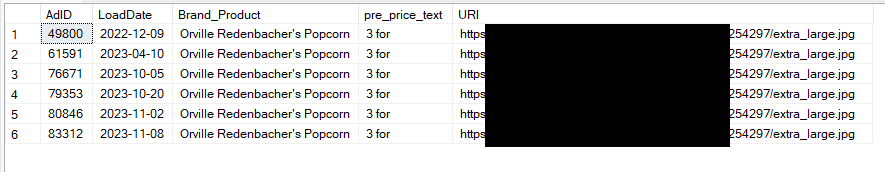
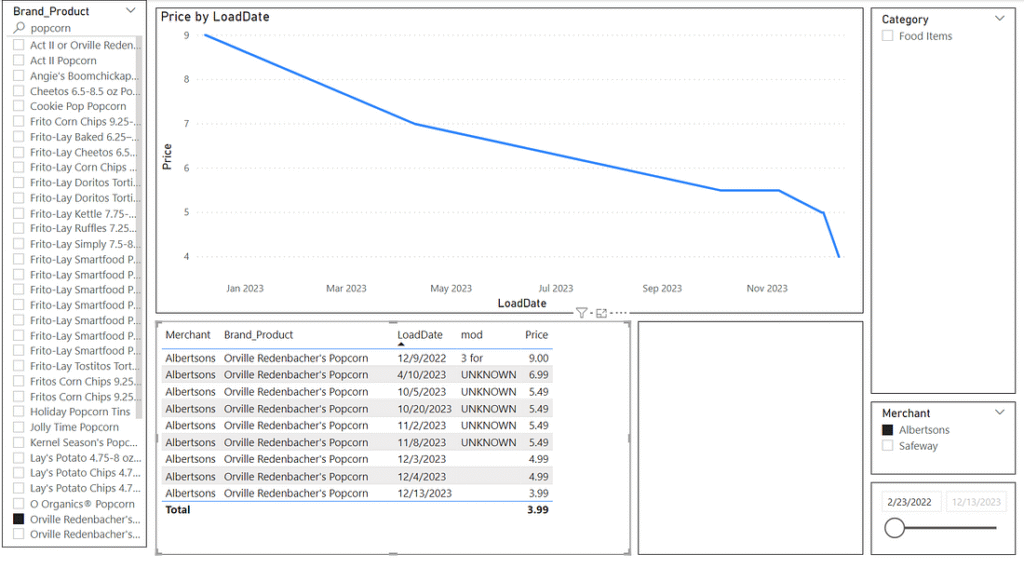
Seeing text data not agreeing with image data and price trends not making sense is a significant concern. The first time I noticed this problem was when I was randomly reviewing the data. I was searching for broad food items and going through brand name products that would likely have multiple sales over the lifetime of our data. When I landed on Orville Redenbacher popcorn I noticed that the price went down significantly over time even when controlling for the specific store and the specific Brand_Product. The data table showed that each instance was the price for 3 boxes, and disturbingly the image for all rows also showed that the sale was 3 for $9.
In order to check if the image URL was actually being updated in the data, I queried the database to see if the same URL was being repeated over and over, and sure enough it was. This means either the data source isn’t updating the image, or more likely there is a problem with my ETL.
SELECT
    AdID,
    LoadDate,
    Brand_Product,
    pre_price_text,
    URI
FROM [dbo].[FACT_Ad_v3] fact
LEFT JOIN DIM_Industry_v3 i ON fact.IndustryID = i.IndustryID
LEFT JOIN DIM_Merchant_v3 m ON fact.MerchantID = m.MerchantID
LEFT JOIN DIM_Product_v3 p ON fact.ProductID = p.ProductID
WHERE p.Brand_Product LIKE 'Orville Redenbacher''s Popcorn'
  AND m.Merchant LIKE 'Albertsons'
Next up was to review the stored procedure that takes our data from ADF and inserts it into our FACT and DIM tables. The problem was right there. In the section that populates the product dimension, the first task is to check if the product already exists in our table to prevent duplication. During this step, the only attribute that was checked was the Brand_Product attribute. Since the DIM_Product table also contains the prepricetext and URI attributes, this means that we were losing both of those attributes whenever a sale reused an Brand_Product name. This explains why we were seeing “3 for” in the pre_price_text attribute in the report as well.
-- check if product exists
DECLARE @productid INT;
SET @productid = (SELECT ProductID FROM DIM_Product_v3 WHERE Brand_Product = @brandproduct);

IF @productid IS NULL
BEGIN
    -- insert into dim_product_v3
    INSERT INTO DIM_Product_v3 VALUES (@brandproduct, @productcategory, @prepricetext, @uri);

    -- set @productid to newly created productID
    SET @productid = (SELECT ProductID FROM DIM_Product_v3 WHERE Brand_Product = @brandproduct);
END
Since I don’t have a way to repull old data (maybe some day in the future I will inquire with the owner of the API and ask), my only real solution to maintain data integrity is to fix the problem for future pulls and then mark each instance where this occurred as bad data somehow.
To stop the bleeding, my first task was to fix the problem going forward. This consisted of adding all attributes of DIM_Product into the initial check for existence (the query looks a little complicated due to a workaround I had to utilize because SQL does not allow an equivalence check for NULL values), and then make the same changes at the end when it pulls out the newly created ProductID that is later used to populate the fact table. Note that it was during this phase of making these modifications that I identified the two other issues relating to Fred Meyer query and varchar length of Brand_Product.
-- check if product exists
DECLARE @productid INT;
SET @productid = (
    SELECT ProductID
    FROM DIM_Product_v3
    WHERE Brand_Product = @brandproduct
      AND (
            (@productcategory IS NULL AND Category IS NULL)
            OR Category = ISNULL(@productcategory, 'empty')
          )
      AND (
            (@prepricetext IS NULL AND pre_price_text IS NULL)
            OR pre_price_text = ISNULL(@prepricetext, 'empty')
          )
      AND URI = @uri
);

IF @productid IS NULL
BEGIN
    -- insert into dim_product_v3
    INSERT INTO DIM_Product_v3 VALUES (@brandproduct, @productcategory, @prepricetext, @uri);

    -- set @productid to newly created productID
    SET @productid = (
        SELECT ProductID
        FROM DIM_Product_v3
        WHERE Brand_Product = @brandproduct
          AND (
                (@productcategory IS NULL AND Category IS NULL)
                OR Category = ISNULL(@productcategory, 'empty')
              )
          AND (
                (@prepricetext IS NULL AND pre_price_text IS NULL)
                OR pre_price_text = ISNULL(@prepricetext, 'empty')
              )
          AND URI = @uri
    );
END
In order to mark the bad data appropriately I unfortunately needed to add some bloat to the fact table. This is because the dimension table intentionally does not include an individual row for each load, only the fact table does, and I would need to keep the initial time a product is brought into the database while marking subsequent sales dates as incorrect. The first step was to add a flag attribute to the fact table that would be used to demark the rows with bad data. This schema change would require us to modify the fact table portion of the stored procedure as well by forcing a NULL value into it. This flag being NULL would from this point on indicate a row that doesn’t have this data issue.
ALTER TABLE FACT_Ad_v3 ADD BadProductFlag bit
-- insert fact entry
INSERT INTO FACT_Ad_v3
VALUES (
    @loaddate,
    @startdate,
    @enddate,
    @industryid,
    @merchantid,
    @productid,
    @price,
    NULL
);
With a flag attribute in place to mark rows with bad data, all that was left was to find the rows. There are probably less complex ways to solve this problem, but the solution I came up with was to iterate through each distinct ProductID in the fact table and for the rows matching that ProductID, mark each row that has the earliest start date as well as the MerchantID being equivalent to the first store that loaded data. This was to catch edge cases where the first time the Brand_Product was loaded it was on sale in two different stores, and only the first store details was captured. These marked rows were actually the rows that were captured correctly, so I had to invert the results by going back through and first marking anything that was NULL as ‘1’, and then again going through to mark anything that was ‘0’ as NULL to indicate it as good data. In SQL this looks like the following.
CREATE PROCEDURE [dbo].[UpdateFact] AS
BEGIN
    DECLARE @productid INT

    DECLARE c CURSOR FOR
        SELECT DISTINCT ProductID
        FROM FACT_Ad_v3

    OPEN c
    FETCH NEXT FROM c INTO @productid

    WHILE @@FETCH_STATUS = 0
    BEGIN
        UPDATE FACT_Ad_v3
        SET BadProductFlag = 0
        WHERE ProductID = @productid
          AND StartDate = (
                SELECT MIN(StartDate)
                FROM FACT_Ad_v3
                WHERE ProductID = @productid
          )
          AND MerchantID = (
                SELECT MerchantID
                FROM FACT_Ad_v3
                WHERE AdID = (
                    SELECT MIN(AdID)
                    FROM FACT_Ad_v3
                    WHERE ProductID = @productid
                )
          );

        FETCH NEXT FROM c INTO @productid
    END

    CLOSE c
    DEALLOCATE c
END
GO
-- had to invert results after:
UPDATE FACT_Ad_v3
SET BadProductFlag = 1
WHERE BadProductFlag IS NULL;

UPDATE FACT_Ad_v3
SET BadProductFlag = NULL
WHERE BadProductFlag = 0;
The reason for writing this as a stored procedure is because the query took so long to run that I didn’t want to lose the query as I was working on it over multiple days. With over 15k distinct ProductIDs in the table, multiple nested queries being run on each ProductID, and the cheapest available SQL Server offering in Azure, this query took several hours to run. Since this was working directly with prod data, I really didn’t want to take any chances with damaging data with any errors, so I first created a duplicate fact table to perform testing on. The reason for marking rows that were successful instead of marking rows that contained bad data was due to query complexity. I initially wrote the query to directly mark the bad rows, but it would have taken an estimated 175 hours whereas the inverted solution took slightly over 4 hours plus two 30-second queries at the end.
The end result was that all rows that were affected by the improper DIM_Product table matching were now marked with a value of ‘1’ in the BadProductFlag attribute, which could be used by Power BI to filter out incorrect data while maintaining the price data that accurately flowed into the fact table along with the bad data going into the dim table.
Within Power BI, I again would need to use the fact table for this modified data as that’s where the price data lies. Using DAX (the formula expression language used in Power BI) I added the following two calculated columns to the fact table.
FixedURI = if(FACT_Ad_v3[BadProductFlag] = TRUE, blank(),RELATED(DIM_Product_v3[URI]))
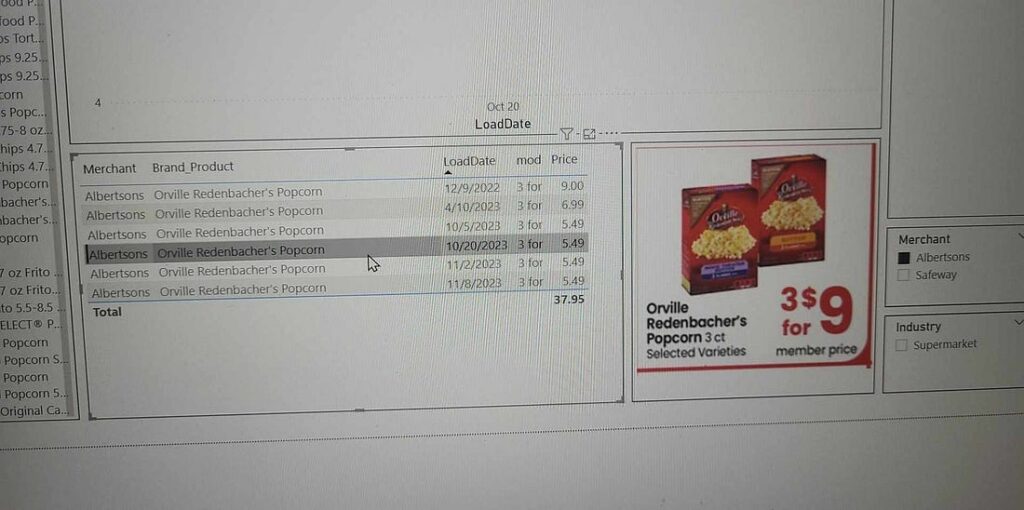
FixedPrePriceText = if(FACT_Ad_v3[BadProductFlag] = TRUE, "UNKNOWN", related(DIM_Product_v3[pre_price_text]))In the Report View, these new columns will take the place of the attributes that previously came from the dim table. Each time Power BI refreshes, these calculated columns will update to stay current. Making the change to the data table visual, we now see that the prepricetxt (renamed to mod in the visual) now shows ‘UNKNOWN’ for the rows that had bad data, and when highlighted these rows will not show any image.
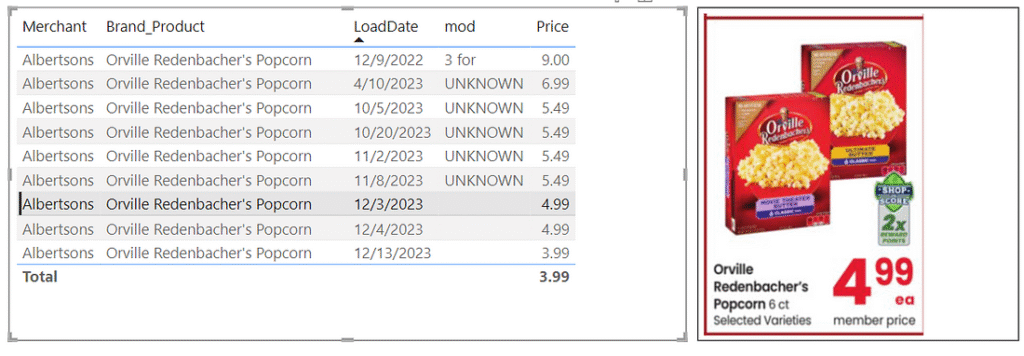
We can also now compare the images for the three distinct price points we have, and can see that while the sale loaded in 12/9/2022 was 3 boxes of 3 packs for $9, the prices reflected on 12/3/2023, 12/4/2023 and 12/13/2023 are for 1 box of 6 packs. With this insight we can determine that the sales price went from $1 per pack on 12/9/2022 to $0.83 per pack on 12/3/2023 to $0.67 per pack on 12/13/2023.


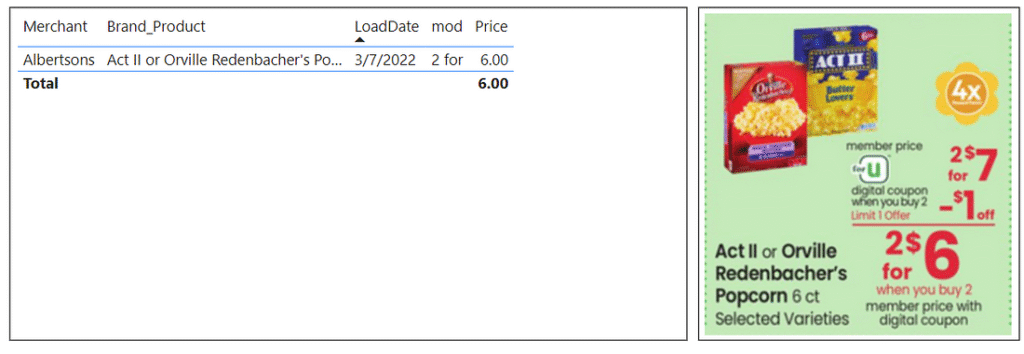
We can find additional advertisements for Orville Redenbacher popcorn from Albertsons under different Brand_Product names, specifically “Act II or Orville Redenbacher’s Popcorn” and “Orville Redenbacher’s Popcorn 6 ct or Wishbone Salad Dressing 16 oz”. One of these came back as bad data as Safeway was running a similar sale at the same time. The other one gives a clear price of $6.00 for 2 boxes of 6 packs, giving a March 2022 price of $0.50 per pack.

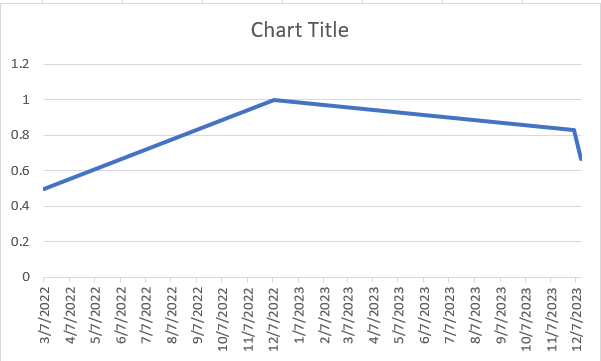
Putting these dates and amounts into a quick Excel chart, this gives us roughly the following price trend for Orville Redenbacher popcorn per pack at Albertsons. This does not take into account economy of scale driving smaller packages to be more expensive than larger packages, and it’s worth noting that the highest price was the only instance that was referring to boxes of 3 packs instead of boxes of 6 packs.
Brand_Product attribute
While working on modifying the stored procedure, I noticed that the staging table contained Brand_Product names that were longer than 100 characters, which is the maximum set on the DIM_Product table. This doesn’t prevent data from loading, but it does truncate these long descriptions to 100 characters. To fix this, let’s change the schema to allow the attribute to have 300 characters.
ALTER TABLE DIM_Product_v3
ALTER COLUMN Brand_Product VARCHAR(300) NOT NULL;
Fred Meyer API
Near the end of fixing the stored procedure I was performing testing on individual pipelines broken out by store. All of them were succeeding except for Fred Meyer. The error message pointed to an issue with the flatten activity in the dataflow, specifically during unrolling. Upon reviewing the actual results in Edge I saw that ‘items’ node was not populating with anything, rather ‘related_items’ was. A quick check on the ███ website proved that Fred Meyer was in fact still supported by the API. Since this was the only store name that contained a space, I decided to try inserting a %20 in the search query to give it a space, and the ‘items’ node began populating again. This was just a quick update to the ‘Relative URL’ attribute in the Fred Meyer dataset within ADF, after which the pipeline succeeded.
?locale=en-us&postal_code=98125&q=Fred%20MeyerReporting Cleaning
In the previous post for Dashboard in Power BI I referenced that prices default to a sum as an aggregation. For our line chart it doesn’t make sense to have a sum as it will simply total up all the products that match current filters for a given date. Minimum, average, and max all work to give the single prices we are looking for, but I have settled on specifically using min just because that is more in line with the concept of sale prices of an item over time. This way if there are two stores that have a sale on the exact same Brand_Product on the same date, our line chart will select the cheaper of the two by default (although in this case, ideally further filtering will be applied such as store name to prevent this).